Infographics are a visual way to provide information quickly and easily. Because of this, they have become an essential element of content marketing. However, creating this type of material can be complicated if you do not have the right tools.
Here, we'll explain what tools you can use to create infographics and what to keep in mind when making them.


What Makes a Good Infographic?
Good infographics clearly display your message in a simple, visual way, which is why they have become a key element in content marketing. However, for infographics to be really effective, a series of key points must be taken into account.
Concise and Well-Structured Content
Infographics should clearly communicate your message, so all the information they contain must be ordered and structured in a coherent way. Ideally, the message should be direct and concise, because if the infographic is too overloaded, it will be much more difficult for the reader to understand it.
Use of Corporate Imagery
If your logo or brand uses specific colors, typography, or design elements, incorporate them into your infographic. This is key to enhance brand identity. When all the content has the same style, the public relates the colors, typography, etc. to your company.
Optimizing Metadata for SEO
All your content must be optimized for SEO, including infographics. These should not slow down the loading time of your website or blog. Additionally, the title and description should not contain accents, commas, parentheses or other similar elements.
When all your content is optimized for SEO, it is much easier to rank in search engines like Google. Therefore everything that you publish must be formatted accordingly.
Adapt the Format to Each Platform
If the same infographic is going to be published on different platforms, it's important to ensure that it is adapted to the format so that not cut off and information is not lost.
Each social network has its own format so it is important to check that your image is correctly displayed in each of them. If the infographic is going to be published in a blog post or on a web page, it must also be adapted.
Include Visual Elements
Visual elements are key in an infographic because they help the reader to retain the information quickly and easily. You can use icons, maps, photographs, drawings, etc. Any visual element that does not overload and adds value to the content can be used. However, it's important not to overuse text or visual elements.
Bet on Interactive Content
Adding interactive content in an infographic has numerous advantages, as it invites the user to get involved and therefore generates greater engagement. Unfortunately, this type of content does not work in all infographics, so do some research on whether the interactive aspect adds value to the content. Interactive content should be related to the subject of the infographic and should not overload it.
Best Online Tools to Create Infographics
Infographics require time and effort to make, but there are tools that can make this much easier and give you great results.
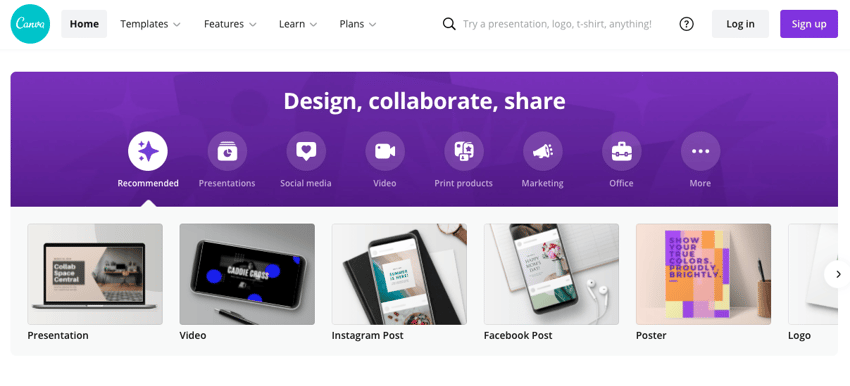
1. Canva
Canva is a very intuitive graphic design tool and using it requires no previous knowledge. It allows you to create both custom designs and use templates. In Canva, you can create images for social networks and infographics, all of which adapt perfectly to each different format.
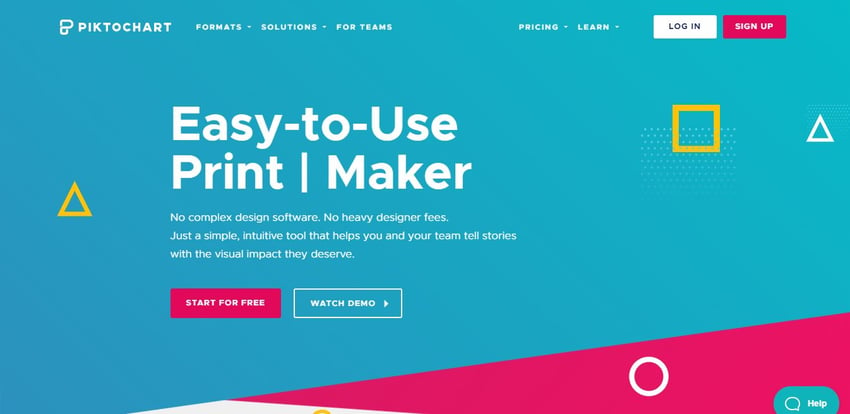
2. Piktochart
Piktochart is an application that lets you create infographics without previous knowledge of graphic design. It offers numerous templates so creating content is very simple, but best of all, everything can be modified. That is, you can use corporate colors and typography without problems.
3. Genially
Another great tool for creating infographics is Genially. It allows you to create presentations, dossiers, interactive images and, of course, infographics. It's not necessary to have knowledge in programming or graphic design because, like the others, it is a very intuitive platform. Some large companies such as Unilever and McDonalds have used this program.

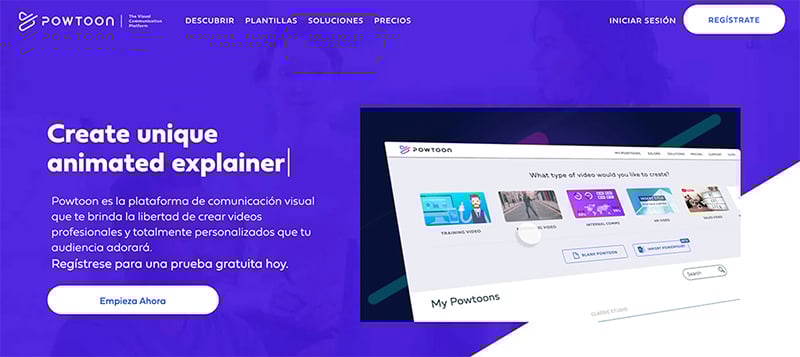
4 Powtoon
The name Powtoon was born from the fusion of PowerPoint and cartoon, since this tool was designed to create animated presentations and videos. It is one of the best programs to create videos with infographics. All the material can be created with imported images, music, or voice recordings.
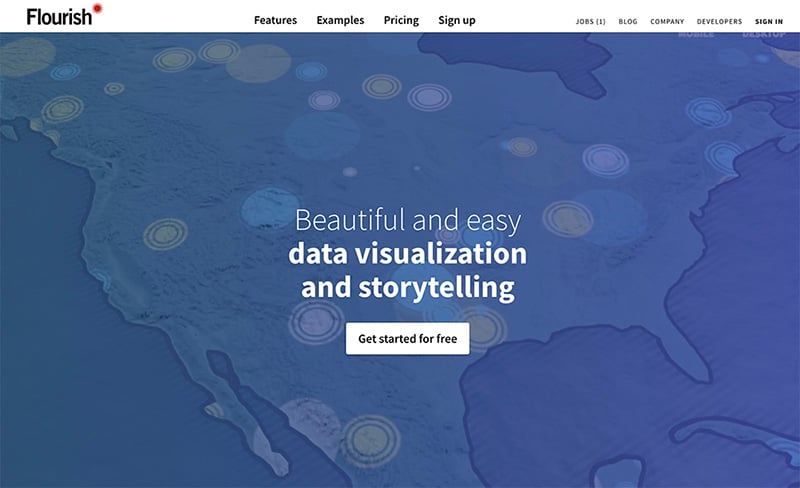
5. Flourish
Flourish is a free platform, although it does have a paid premium version. It is one of the most complete tools because it allows you to create everything: graphs, tables, maps, interactive infographics, etc. with high quality results. Some well-known international brands have used this program, such as Shopify, Disney, Google, and Revolut.
6. Datawrapper
Finally, another tool you can use to create infographics and other content is Datawrapper. Unlike the rest, this program is designed specifically to create tables and maps. It also allows you to create infographics quickly and easily.
As you see, infographics provide information in a clear and engaging way. However, it's important to pay attention to the details. For instance, those that are too overloaded or that do not adapt to the format of the page where they have been published, don't tend work. If you want your infographics to be a success, just follow our tips!


Diana Palau
Digital Marketing Strategist at Cyberclick. Degree in Advertising and Public Relations (URV), with a postgraduate degree in Marketing and Online Communication (UAB). Specialized in Google Ads, Social Ads and web analytics.


Leave your comment and join the conversation