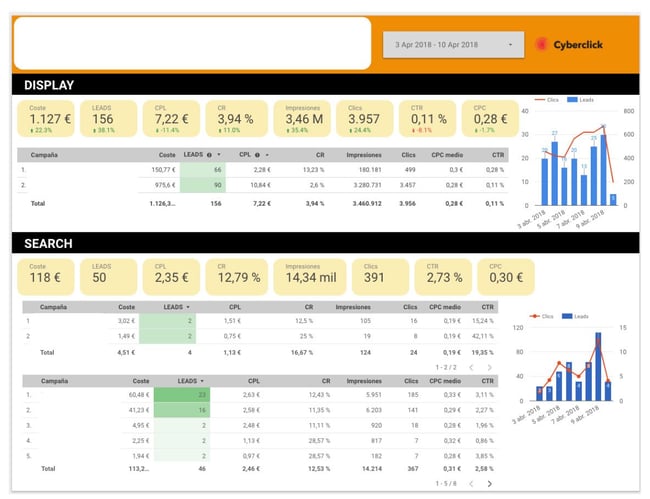
If we look for the key to the success of many marketing campaigns, we often see that the secret is not incredible innovation or a huge budget, but simply having a good measurement strategy and following it. A dashboard is an information management tool that monitors, analyzes and gives you a visual display of key performance indicators (KPIs), metrics, and important data to track the status of your company, a department, a campaign, or a specific process.
It is a very powerful tool for getting insightful data and centralizing the KPIs you need in order to know what's really going on with your business and avoid an overdose of unnecessary information that can make us lose sight of the bigger picture. A dashboard should be customizable, as visual as possible, practical, and ideally should be in real time. That being said, a dashboard is only as valuable as the information included in it, so it is crucial to make sure you are showing accurate and relevant information.

Characteristics of a Dashboard
Think of the dashboard as a sort of summary that gathers data from different sources in one place and presents it in a digestible. These are some of the features that it has:
-
Customization
A dashboard should only contain the KPIs that are relevant to the department, campaign, or process at hand. To guide it, consider the central questions you want to answer. For instance, what are the main sources of traffic to our website, how your sales funnel works, and what are the 5 products that generate the most income? -
Visuals
The purpose of a dashboard is to get the information you are looking for at a glance. Therefore, data is shown in the form of graphs and you can have quick indicators through colored keys, up or down arrows, or highlighted figures, for example.
-
Practicality
The main function of a dashboard should always be to help direct the actions of your team. Because of this, it should provide the information needed in order for you to know what are the next steps to take to improve results.
-
In real-time
Today, digital marketing evolves very quickly so taking advantage of the present moment is crucial. Due to this, information should be updated regularly and displayed on the dashboard in real-time.
Why Your Company Needs a Dashboard
-
Because it will allow you to measure multiple KPIs and metrics simultaneously. If you manage complex campaigns, you usually end up having several analytics solutions for each platform and needing to consult them separately, which hinders the overall view. Instead, the dashboard displays data from different sources, like web analytics solutions, social media metrics, and data from your CRM. This way, it makes it much easier to compare them and see how they develop.
-
Because it's easy to understand. A good dashboard clearly shows you a number of key metrics so you don't need to be an analytics expert to understand them. If you want to look further into a particular data set, you always have the option of employing more specific tools.
-
Because it makes data easily accessible. If you synchronize your dashboard automatically in the cloud, you can create different users so that your entire team can access the same information from anywhere. It's even possible to project the dashboard onto a screen in your office so that the whole team can see what is going on in real-time.
-
Because it makes reporting more efficient. Having a centralized dashboard will save you a lot of time. Instead of collecting data from different sources and making charts on your own, dashboards do all this work for you. You just need to invest some time at the beginning to set up the metrics and decide how to present them. From that point on, the reports are created automatically.
Metrics and KPIs to Include in Your Dashboard
Now comes the big question: what data should you include in your control panel? The answer depends on each company and its goals, given that customization is one of the main features of a dashboard. Nevertheless, let's take a look at some of the key KPIs that may be of interest in a digital marketing dashboard or a sales dashboard.
7 Metrics for the Digital Marketing Dashboard
-
The number of visitors to the brand's websites. This metric alone is not particularly informative, since visits are only the first step in a customer's journey. It is, however, good to keep tabs on this and know if you are succeeding in attracting users. If not, you can then take the necessary steps to remedy this.
-
New and returning visitors. Here you can begin to delve deeper into what is happening on our website and gain a better understanding of visit patterns. In many cases, a user will need to visit several times before converting.
-
Bounce rate. This is essential data because it tells you if your website is appealing and if it meets the users' expectations. If the bounce rate is very high, this generally means that you need to take action before continuing to optimize the rest of your strategy. You can also correlate the bounce rate to the average time of visits to your site.
-
Conversion funnel. Generally, this KPI is shown literally with a funnel graph that displays the different stages of the conversion process along with the users who have reached each of them. It is crucial to understand this so that you can optimize the steps of the funnel and identify users with a high rate of abandonment.
-
Customer acquisition cost. This is an important step in order to be able to accurately measure the return on investment.
-
Customer lifetime value. This refers to the amount of revenue a customer generates throughout his or her relationship with the brand. This includes all repeat purchases.
-
Return on investment. This metric is the ultimate KPI because it tells you if the money you invested in marketing has led to increased profits. To get the most from this, you need to distinguish between channels, campaigns, and actions. Discard the ones that fail to yield a positive ROI and focus your budget on the most profitable ones. If you combine this with the two previous strategies, you will soon see whether it makes more sense to reduce the acquisition cost of each customer or to focus on building customer loyalty and increasing a customer's lifetime value.
8 Metrics for the Sales Dashboard
-
Monthly sales growth. Normally, you check-in at the beginning and end of each month, as that lets you better compare the data. When setting up your dashboard, you can have the results displayed to compare the last 30 days, the last calendar month, or the current month with the same month last year.
-
Average sales margin. To get better results, it's essential to know not only the number of total sales but also the margin we obtain with each sale. It is also useful to collect information on the products with the highest and lowest margins during a given period.
-
The number of sales qualified leads. The sales process generally starts when the marketing team sends the contact details of a potential client or buyer to the sales team. Tracking the number of leads sent will help you coordinate these two key departments in your company.
-
Lead-to-sales conversion rate. This refers to how many of the contacts that you received during a given period of time have become customers. This KPI is essential to see if you need to increase the number of leads received or to focus your efforts on strategies that improve conversion.
-
Average purchase value. Because obtaining leads and converting them into customers comes at a higher cost, you may be interested in tracking this data to see if the investment is profitable or if you need strategies to increase the size of the cart.
-
Monthly contacts from each sales representative (calls, emails, etc.). This metric is designed to oversee the team and monitor their productivity
-
Sales by contact method. This metric tells you the most effective means to achieve conversions: calls, emails, in-person visits, etc. This way you can focus your efforts on the most profitable ones.
-
Best-selling products. A comparison between the sales volume obtained by a product and its commercial margin is also an important metric to keep track of.

Laia Cardona
Responsible for content and brand visibility strategy at Cyberclick, with an Allbound approach and specialization in SEO, GEO (Generative Engine Optimization), and AI-powered automation. Advanced HubSpot CRM management: database segmentation, workflows, lead nurturing, scoring, and reporting. Background in digital marketing, corporate communications, and journalism—combining strategy, creativity, and technology to attract and convert qualified leads.

Leave your comment and join the conversation