When managing a digital presence—whether through a Shopify ecommerce site or a corporate blog—understanding your bounce rate is essential. This key metric reveals how visitors interact with your pages and whether your content meets their expectations. By analyzing it correctly, you can identify opportunities to strengthen Google Analytics insights and make data-driven decisions that improve performance.
A bounce rate that’s too high may signal issues such as slow load times, confusing navigation, or content that doesn’t resonate with user intent. On the other hand, in some cases, a high bounce rate can be perfectly normal, especially if the page is designed to provide users with a complete and comprehensive response after their first visit. The challenge lies in knowing when it’s a warning sign and when it’s simply a reflection of user behavior. In this article, you’ll learn how to calculate bounce rate effectively, interpret it across different contexts, and use it as a lever to increase conversion rate and strengthen long-term user retention.


Understanding Bounce Rate
Bounce rate refers to the percentage of visitors who land on a website or app page and then leave without interacting further (aka leaving with no clicks, scrolls, or conversions). In simple terms, it measures how many users exit after a single-page session.
A high bounce rate can point to several issues:
- Page performance problems, such as slow loading times or technical errors.
- Content misalignment when the information presented doesn’t meet user expectations.
- Poor usability or design that discourages further exploration.
That said, not all bounces are bad. A visitor who comes to read a blog article that fully answers their question and then leaves has technically “bounced,” but they may still consider the visit successful. For this reason, bounce rate should never be analyzed in isolation. Instead, it should be studied alongside other website metrics, such as traffic volume, conversion rate, and engagement rate, to gain a comprehensive understanding of user behavior.
Bounce rate should also be measured against exit rate. Exit rate shows the percentage of users who leave after viewing a specific page, regardless of how many pages they visited before. Comparing the two can help you identify whether a page drives users away immediately or simply serves as the logical endpoint of their journey.
How to Find Your Bounce Rate (Using Google Analytics 4)
With the transition to Google Analytics 4 (GA4), the way bounce rate is measured has changed. In Universal Analytics (GA4’s predecessor), bounce rate was calculated as the percentage of single-page sessions with no interaction. In GA4, bounce rate is essentially the inverse of engagement rate, meaning that it focuses on how many sessions were not engaged.
An engaged session in GA4 is defined by at least one of the following actions:
- Lasting longer than 10 seconds
- Triggering a conversion event
- Viewing two or more pages/screens
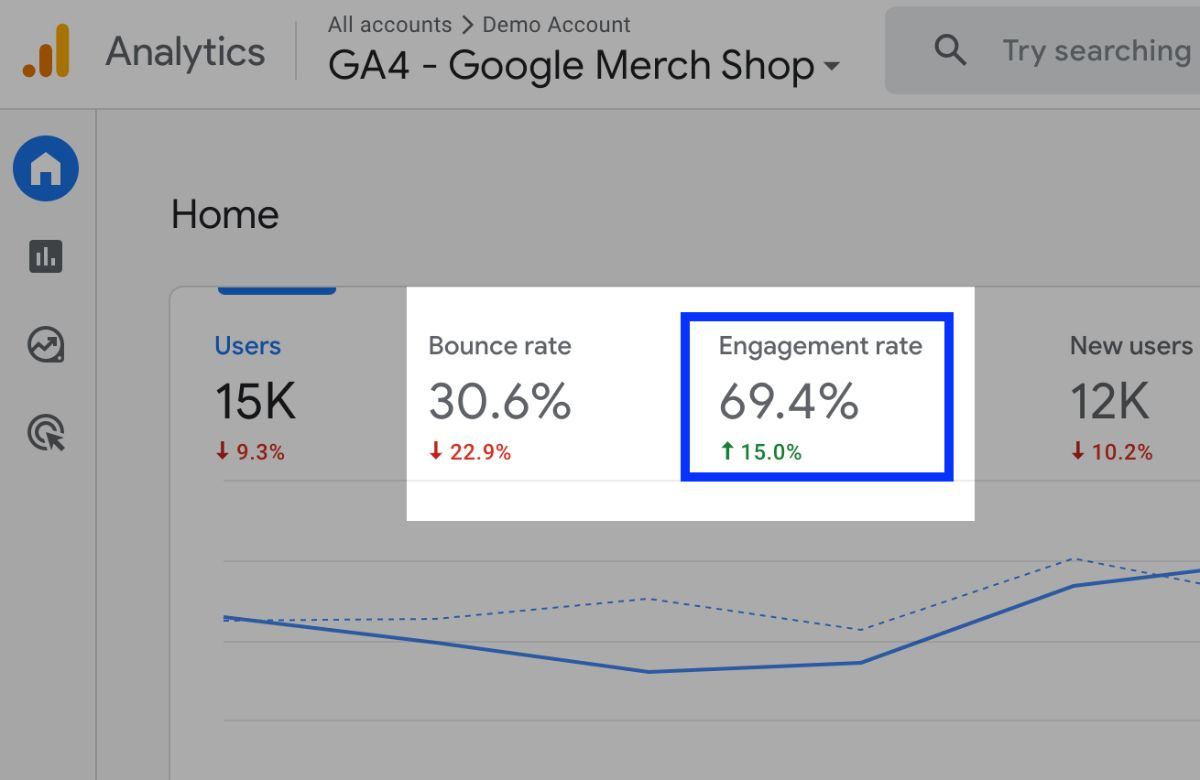
So, the bounce rate in GA4 is calculated as:
Bounce Rate = 100% – Engagement Rate
For example, if your website shows a 70% engagement rate, the bounce rate will be 30%.
To view bounce rate in GA4, you can:
- Open your Reports section and navigate to Engagement → Pages and Screens.
- Customize your report to include Bounce Rate as a metric.
- Compare it with other web analytics indicators such as session duration, conversion rate, and traffic sources to identify patterns.
This shift emphasizes a more holistic view of user behavior. Instead of focusing solely on whether someone left after one page, GA4 encourages users to consider whether a session had meaningful interaction. For ecommerce brands, especially those tracking ecommerce metrics, this makes it easier to align bounce rate insights with business goals.
Understanding Engagement Rate in GA4
To truly make sense of bounce rate in GA4, you need to understand its counterpart: engagement rate. This metric measures the percentage of sessions that meet GA4’s criteria for active user interaction.
An engaged session is one where users go beyond a passive visit. They may click through to another page, trigger a key event, or spend meaningful time on your site. For example:
- A visitor exploring multiple product pages on your Shopify store.
- A reader downloading a resource after finishing a blog article.
- A potential customer completing a form or watching a video.
The formula is straightforward:
Engagement Rate = Engaged Sessions ÷ Total Sessions × 100
Since bounce rate is simply the inverse, both metrics should be reviewed together. A 65% engagement rate means a 35% bounce rate.
Why does this matter? Because engagement rate provides a more accurate measure of website engagement and visitor behavior than the older bounce rate calculation. It shifts the focus from what users didn’t do to what they did.
While bounce rate can highlight potential friction points, engagement rate helps you identify what’s working well, which campaigns drive deeper interactions, and where you can optimize to increase conversion rate.
Website and App Bounce Rate
When analyzing bounce rate for websites and apps, context is everything. A high percentage doesn’t always mean failure. Its meaning depends on the type of page, the user’s intent, and the overall site performance.
Common Causes of High Website or App Bounce Rates
- Slow loading times: even a one-second delay can push visitors away.
- Poor mobile optimization: users leave sites that don’t adapt well to smaller screens.
- Unclear navigation: if people can’t find what they’re looking for quickly, they leave.
- Weak content relevance: misaligned keywords or promises that don’t match the content frustrate visitors.
When a High Bounce Rate Isn’t a Problem
Some pages are naturally designed for single interactions. Examples include:
- Blog posts. A user searching for a specific answer may read the article and leave satisfied.
- Contact or location pages. If someone finds your address or phone number and exits, the page has still done its job.
- Landing pages. Campaign-driven pages often aim to capture one action, like filling out a form.
To determine whether bounce rate is healthy or problematic, compare it with related web analytics:
- Engagement rate. Shows whether users interacted meaningfully.
- Page performance. Reveals technical factors like load speed and device compatibility.
- Conversion rate. Indicates whether users took the intended action.
By cross-referencing these website metrics, you’ll see whether the bounce rate signals an issue or simply reflects normal visitor behavior.
Email Bounce Rate
While website bounce rate measures single-page sessions, email bounce rate refers to the percentage of messages that were not successfully delivered to recipients. It’s a critical metric in web analytics and digital marketing because a high bounce rate can harm deliverability, sender reputation, and overall campaign success.
Types of Email Bounces
- Hard bounces. Permanent failures caused by invalid, inactive, or non-existent email addresses. These addresses should be removed from your list immediately.
- Soft bounces. Temporary failures, often due to full inboxes, server issues, or message size limits. These may resolve on their own, but repeated soft bounces should be monitored.
Why Email Bounce Rate Matters
A high email bounce rate affects more than just message delivery:
- Lower sender reputation. Internet service providers (ISPs) track bounces to assess whether your emails are trustworthy.
- Reduced campaign reach. Emails that bounce don’t contribute to website engagement or conversions.
- Wasted resources. Time and budget spent on undeliverable emails dilute campaign ROI.
Best Practices to Reduce Email Bounce Rate
- Regularly update your email list and remove invalid addresses.
- Use double opt-in to confirm subscriber interest.
- Monitor deliverability rates across campaigns and providers.
- Keep content relevant, mobile-friendly, and aligned with user expectations.
By monitoring email bounce rates alongside traffic and conversion data, you can make sure that your outreach campaigns support your broader site performance goals.
The Big Picture
Understanding bounce rate is more than just tracking a percentage. It’s about uncovering how users interact with your digital touchpoints and what drives them away. This metric provides actionable insights into both website engagement and campaign effectiveness.
Strategic Implications
- User experience signal. A high bounce rate may highlight friction points in design, navigation, or page performance.
- Content relevance. It shows whether your messaging aligns with search intent and target audience expectations.
- Conversion insights. By analyzing bounce rate alongside conversion rate and engagement rate, you can spot opportunities to increase conversion rate.
Operational Implications
- Website optimization. Teams can prioritize fixes that improve site performance and reduce user frustration.
- Traffic quality. Bounce rate helps distinguish between valuable visits and unqualified clicks from irrelevant sources.
- Channel evaluation. Comparing bounce rates across email, paid ads, and organic traffic reveals which campaigns drive the most meaningful visitor behavior.
For ecommerce and digital-first businesses, bounce rate is closely tied to ecommerce metrics like customer acquisition cost and lifetime value. Improving it often leads to stronger retention, higher engagement, and ultimately, better ROI.
Final Thoughts
Bounce rate is one of the most telling website metrics you can track, but it should never be viewed in isolation. Whether you’re analyzing page performance, monitoring visitor behavior, or improving user retention, bounce rate is most valuable when paired with other indicators like engagement rate and conversion rate.
In Google Analytics 4, the shift from traditional bounce rate to engagement-focused reporting encourages you to think less about who leaves and more about who stays—and why. This change is especially useful for ecommerce businesses, where metrics like ecommerce metrics and campaign ROI depend heavily on understanding the nuances of user journeys.
By taking a strategic approach, you’ll be able to transform bounce rate from a confusing percentage into a practical tool for improving website engagement, refining your digital strategies, and delivering lasting results.


Marina Sala
AI-Driven Business Digital Strategy Consultant at Cyberclick. Expert in ecommerce, user experience (UX), inbound marketing and CRO strategies focused on maximising conversions. She helps companies integrate AI into their business and make better digital decisions to drive growth and efficiency.


Leave your comment and join the conversation